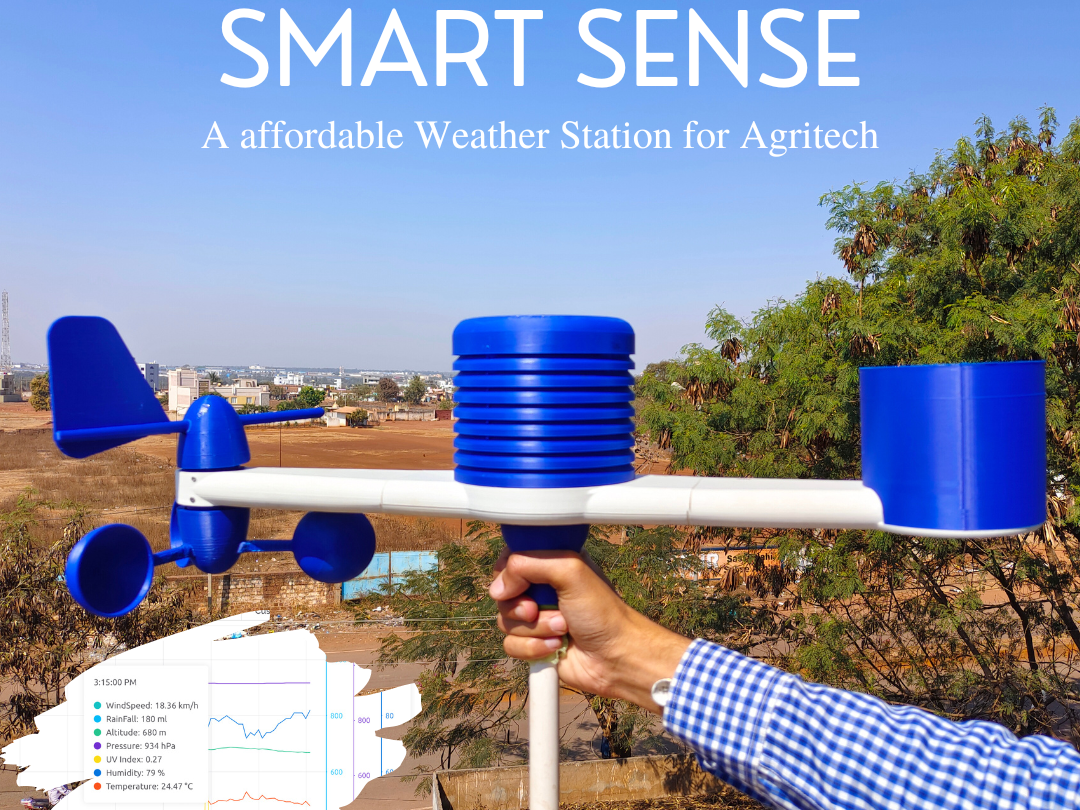
Smart Sense

Components Used
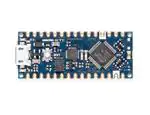
Powered by
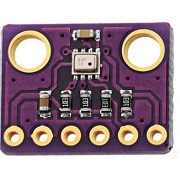
BMP280 is digital pressure sensor used for measuring pressure and temperature with I2C/ SPI.
485-2651
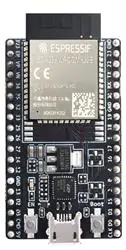
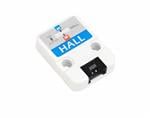
5mm Magnets
× 5Ball Bearing
× 1https://www.amazon.in/Bearing-Shielded-Miniature-Bearings-Skateboard/dp/B07DZDG7T1#:~:text=%5B607ZZ%20DIMENSIONS%5D%20Inner%20Bore%20%3D,Material%3A%20High%20quality%20carbon%20steel.
PROBLEM STATEMENT:
Agrometeorology plays an important role in Precision Agriculture for resource management and effects both the quality and quantity of agriculture products. The existing solutions for monitoring weather parameters in agrometeorology are highly global and costly. These solutions are most of the time are inaccessible to the common man or farmers and require frequent physical visits to the field for obtaining information. But in agriculture monitoring highly localized weather condition is required because the weather conditions applicable farmland of one city may not be as such for a farmer of small rural. Weather conditions such as wind speed, wind direction, rainfall, solar radiation, atmospheric pressure, air particle level humidity and temperature measurement plays an important role in different fields like Agriculture, Science, Engineering and Technology.
EXISTING SYSTEMS:
TRADITIONAL METHODS
In traditional methods, we use traditional equipments like mercury thermometer, barometer, campbell-Stokes sunshine recorder, pan evaporation method, rain gauge, etc. From these equipments, they get parameters which are used for calculating the final result(weather data).

Mercury Thermometers

Water Evaporation Measurement Tool

Rain Fall Measurement Tool
WEATHER SATELLITE
A weather satellite is a type of satellite that is primarily used to monitor the weather and climate of the Earth. Satellites can be polar orbiting (covering the entire Earth asynchronously), or geostationary (hovering over the same spot on the equator). While primarily used to detect the development and movement of storm systems and other cloud patterns, meteorological satellites can also detect other phenomena such as city lights, fires, effects of pollution, auroras, sand and dust storms, snow cover, ice mapping, boundaries of ocean currents, and energy flows. Other types of environmental information are collected using weather satellites.

DATA LOGGER
A data logger (also data logger or data recorder) is an electronic device that records data over time or in relation to location either with a built in instrument or sensor or via external instruments and sensors. Increasingly, but not entirely, they are based on a digital processor (or computer), and called digital data loggers (DDL).They generally are small, battery powered, portable, and equipped with a microprocessor, internal memory for data storage, and sensors. Some data loggers interface with a personal computer, and use software to activate the data logger and view and analyze the collected data, while others have a local interface device (keypad, LCD) and can be used as a stand-alone device. One of the primary benefits of using data loggers is the ability to automatically collect data on a 24-hour basis. Upon activation, data loggers are typically deployed and left unattended to measure and record information for the duration of the monitoring period. This allows for a comprehensive, accurate picture of the environmental conditions being monitored, such as air temperature and relative humidity.

PROPOSED SYSTEM:
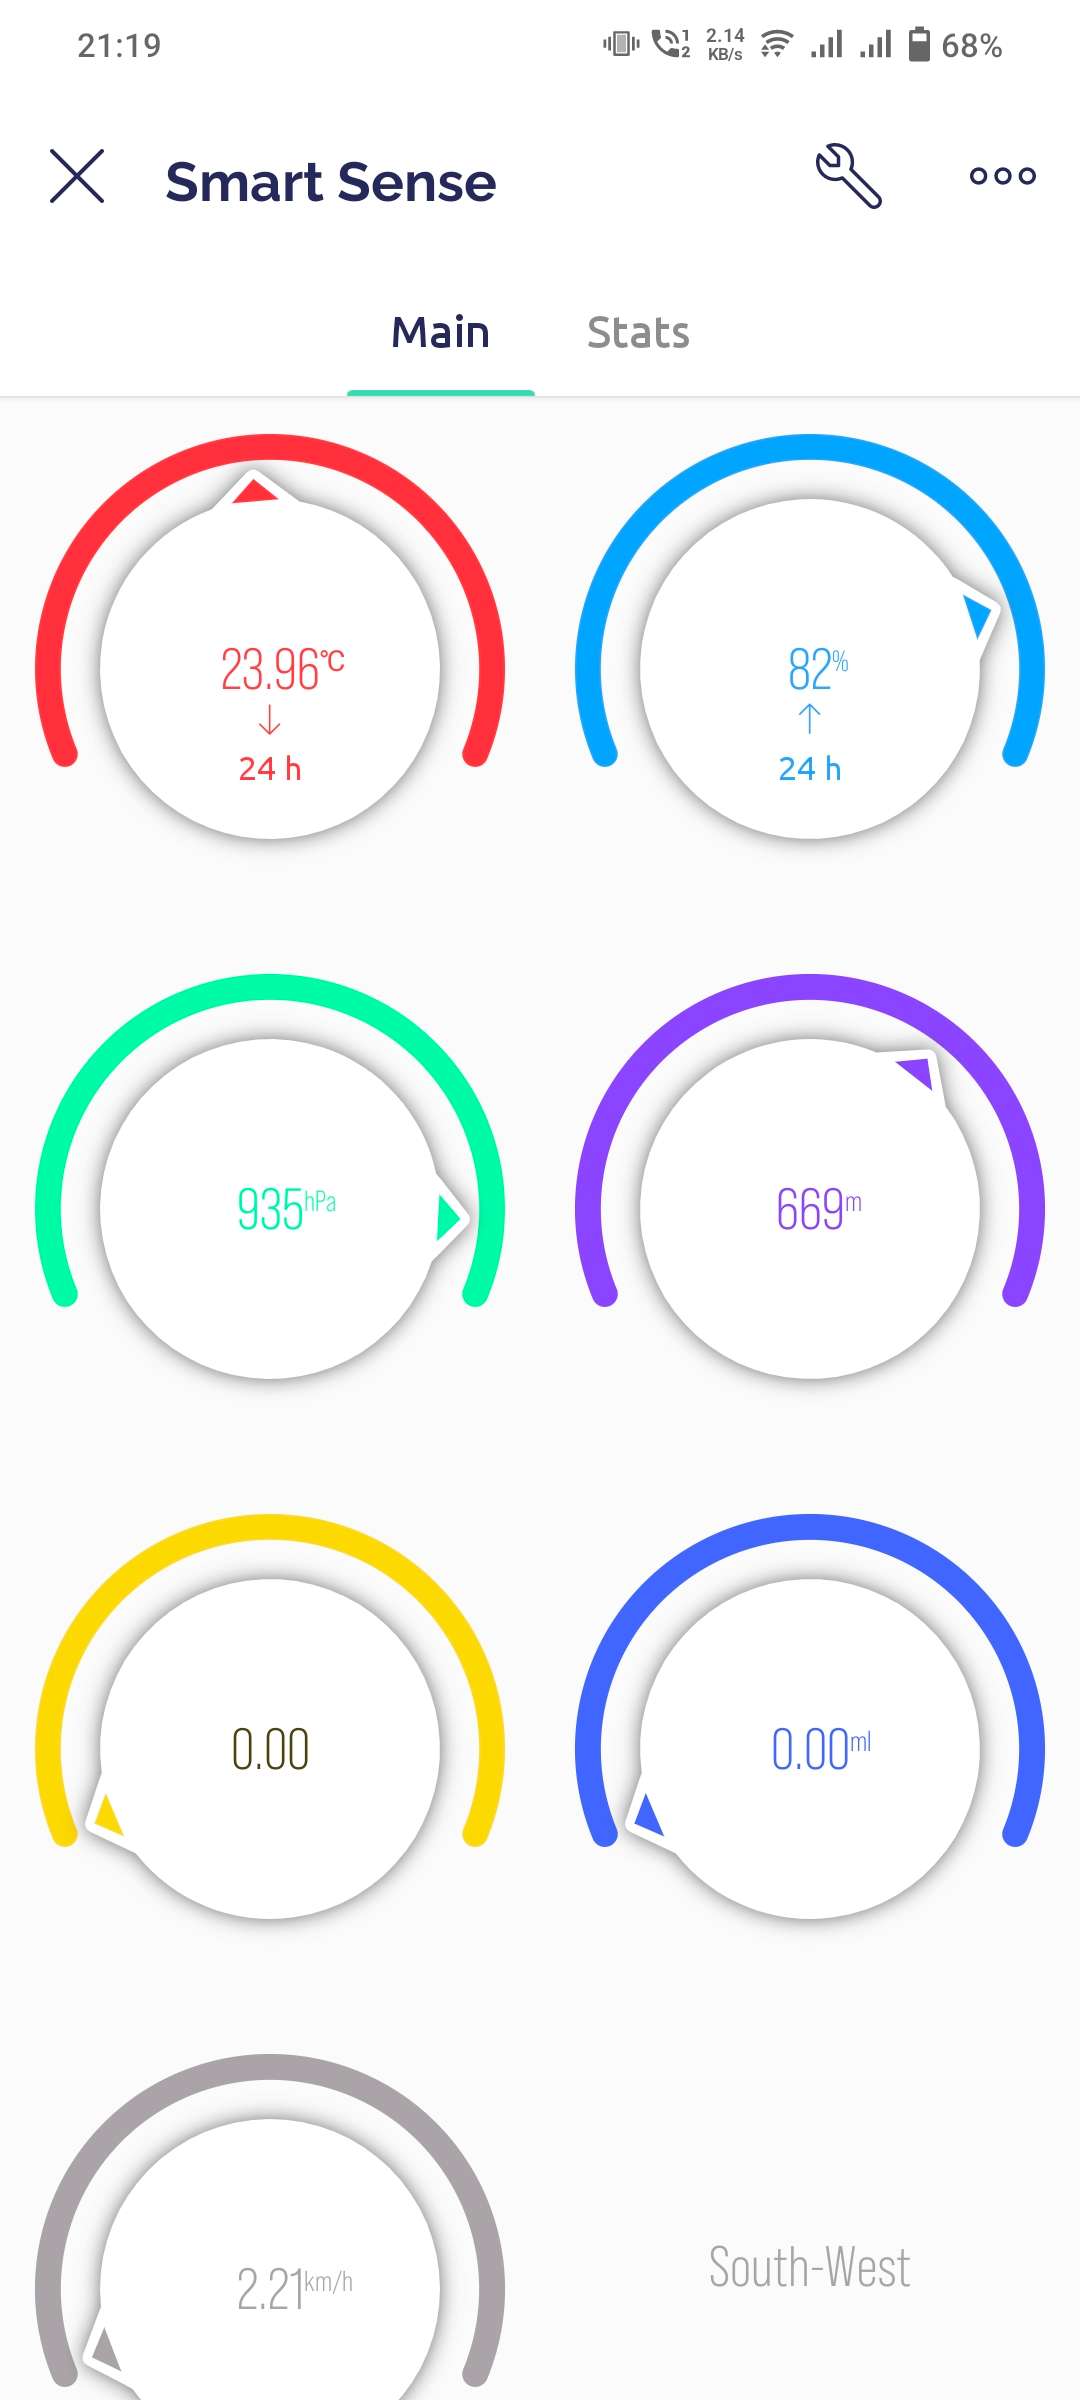
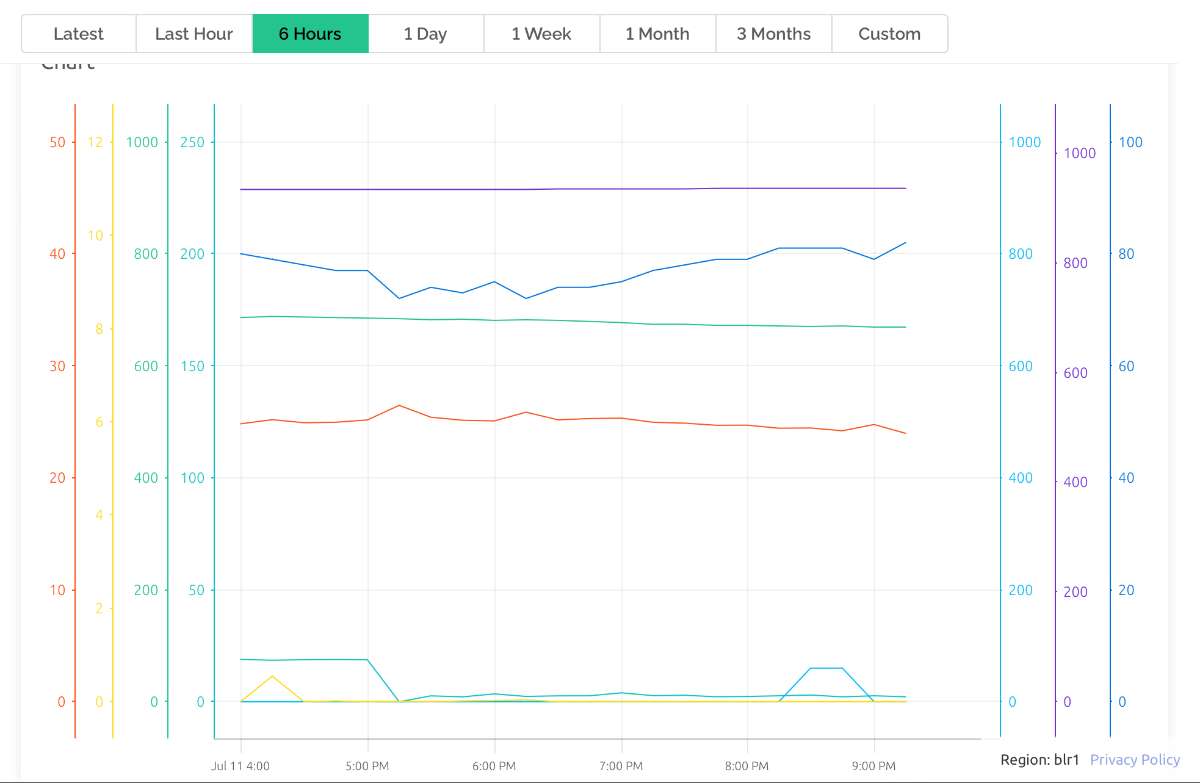
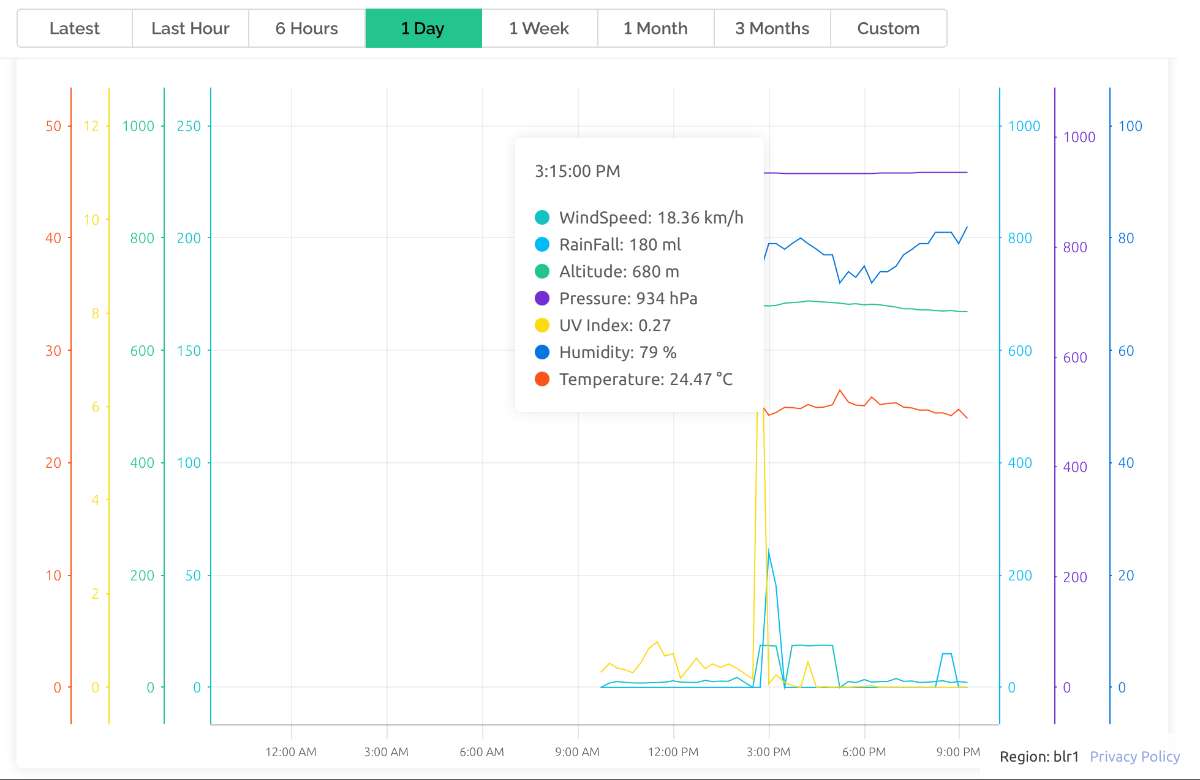
The proposed work provides an optimal solution for monitoring the weather conditions at extremely local level with low cost, compact Internet of Things (IoT) based system. In SENSING AND PREDICTING WEATHER FORECAST FOR SMART FARMING, we are going to monitor a few most important environmental parameters like temperature, humidity, UV index, wind speed, wind direction, atmospheric pressure and rainfall. It transmits real-time data through wireless communication protocol to a cloud platform. The data from the device is accessible on a dashboard that visualizes and analyzes the data in the desired formats. In terms of power consumption and cost, it is not a good idea to connect every sensor node individually to the cloud. Rather it is a good idea to collect data from all the sensor nodes of a small area and publish all the data to the cloud from a single gateway.
IMPLEMENTATION
MEASUREMENTS TECHNIQUES:
Tipping Bucket Rain Gauge
The most common rain detector used in electronic weather stations is the "tipping bucket" type of rain sensor. This interesting technology uses two small "buckets" mounted on a fulcrum (balanced like a see-saw). The tiny buckets are manufactured with tight tolerances to ensure that they hold an exact amount of precipitation, typically .01 inch. The tipping bucket assembly is located underneath the rain collector, which funnels the precipitation to the buckets. As rainfall fills the tiny bucket, it becomes overbalanced and tips down, emptying itself as the other bucket pivots into place for the next reading. The action of each tipping event triggers a small switch that activates the electronic circuitry to transmit the count to the indoor console, recording the event as .01 inch of rainfall. On a wireless rain gage, that count is transmitted via a radio signal.
For detailed information about weather station set up, please review that section elsewhere in our education center. Be aware that the accuracy of a tipping bucket rain gauge degrades significantly if it is installed on a non-level plane, so it is critical that it be mounted on a level surface (a bubble level can be used to make sure of it). The surface should also be free of vibration. Follow the manufacturers instructions when installing your tipping bucket rain gauge and be sure to verify that the path for water runoff from the drain screens is unobstructed.
Once the rain detector has been installed, you will need to check to see if the bucket assembly has been secured from movement during shipment. Often manufacturers use some type of fastener (like a cable tie) to hold the assembly steady until it's been installed. If you find that there is a fastener, carefully remove it.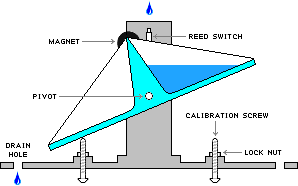
Tipping Bucket Rain Gauge
Anemometer
The instrument that measures wind speed is the anemometer. Most anemometers consist of three (or more) hemispherical cups (cup anemometer) mounted on a vertical shaft. The WIND VANE difference in wind pressure from one side of a cup to the other causes the cups to spin about the shaft. The rate at which they rotate is directly proportional to the speed of the wind. The spinning of the cups is usually translated into wind speed through a system of gears, and may be read from a dial or transmitted to a recorder.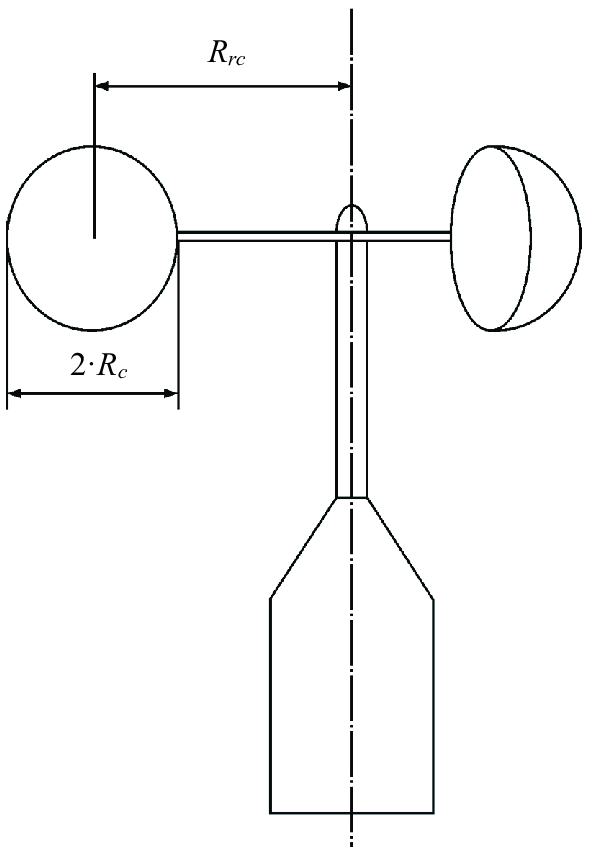
The wind-measuring instruments described thus far are “ground-based” and only give wind speed or direction at a particular fixed location. But the wind is influenced by local conditions, such as buildings, trees, and so on. Also, wind speed normally increases rapidly with height above the ground. Thus, wind instruments should be exposed to freely fl owing air well above the roofs of buildings. In practice, unfortunately, anemometers are placed at various levels; the result, then, is often erratic wind observations.
Calculating Wind Velocity from Your Data:
⦁ Anemometers usually carry a meter calibrated in units of speed activated by voltage generated by connecting the vanes to a small electric generator.
⦁ In this anemometer you calculate the wind velocity as follows:
⦁ Measure the distance from cup center to the center of the shaft. It is about 16 cm.
⦁ Count the number of rotations in one minute as the anemometer spins. Use a stopwatch to time the interval and count the number of times the contrast cup passes.
⦁ When a cup makes one full revolution, it covers a distance equal to the perimeter of a circle of radius 8 cm. It covers a distance equal to 2πr, which would mean: 2 x 3.1416 x 8 cm, or 50.3 cm.
⦁ Your anemometer cup therefore moves through 50.3 cm each time it revolves.
⦁ Calculate the speed of your anemometer. Example: you counted 60 revolutions in one minute. Your anemometer speed would be 60 RPM (revolutions per minute). It means a linear distance of 60 x 50.3 cm covered per minute.
⦁ Convert this into km/hr using the following calculation: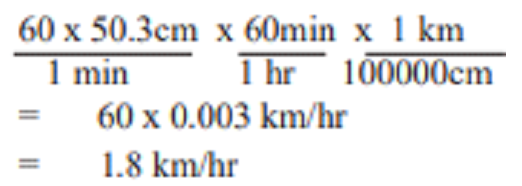
⦁ If you had counted 30 revolutions per minute instead of 60, your anemometer speed would have been 30 x 0.003 km/hr; or if the number of revolutions were 15, the anemometer speed would be 15 x 0.003 km/hr. You can use a “shortcut” method in calculating the anemometer speed. Multiply the rpm by 0.03 to obtain your anemometer speed in km/hr.
CAD Designing:
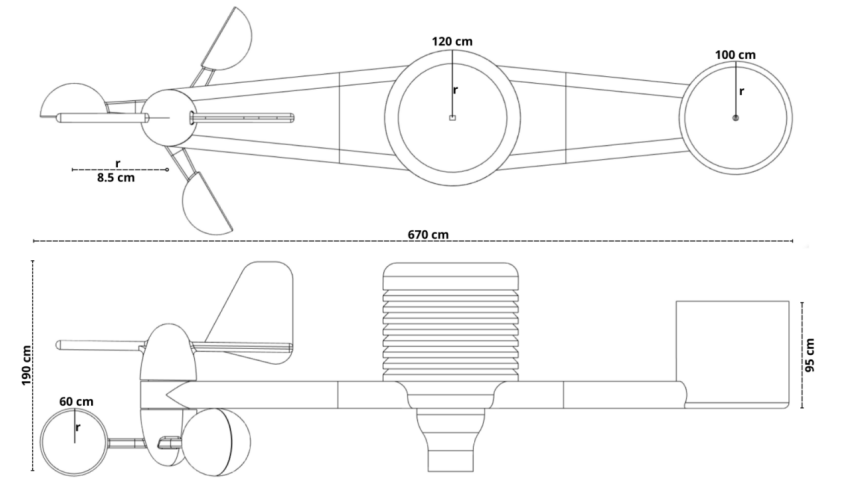
- The Model is designed in Fusion 360
- Due to the printer size limit the model is designed as modular parts.
- This parts can be easily joined.
- You can download the .stl files from below.
- Full Fusion 360 Design for any improvements you want to add.
.png)
.png)
3D Printing:
- The parts are printed with my Ender 3 3D Printer.
.png)
.png)
.png)
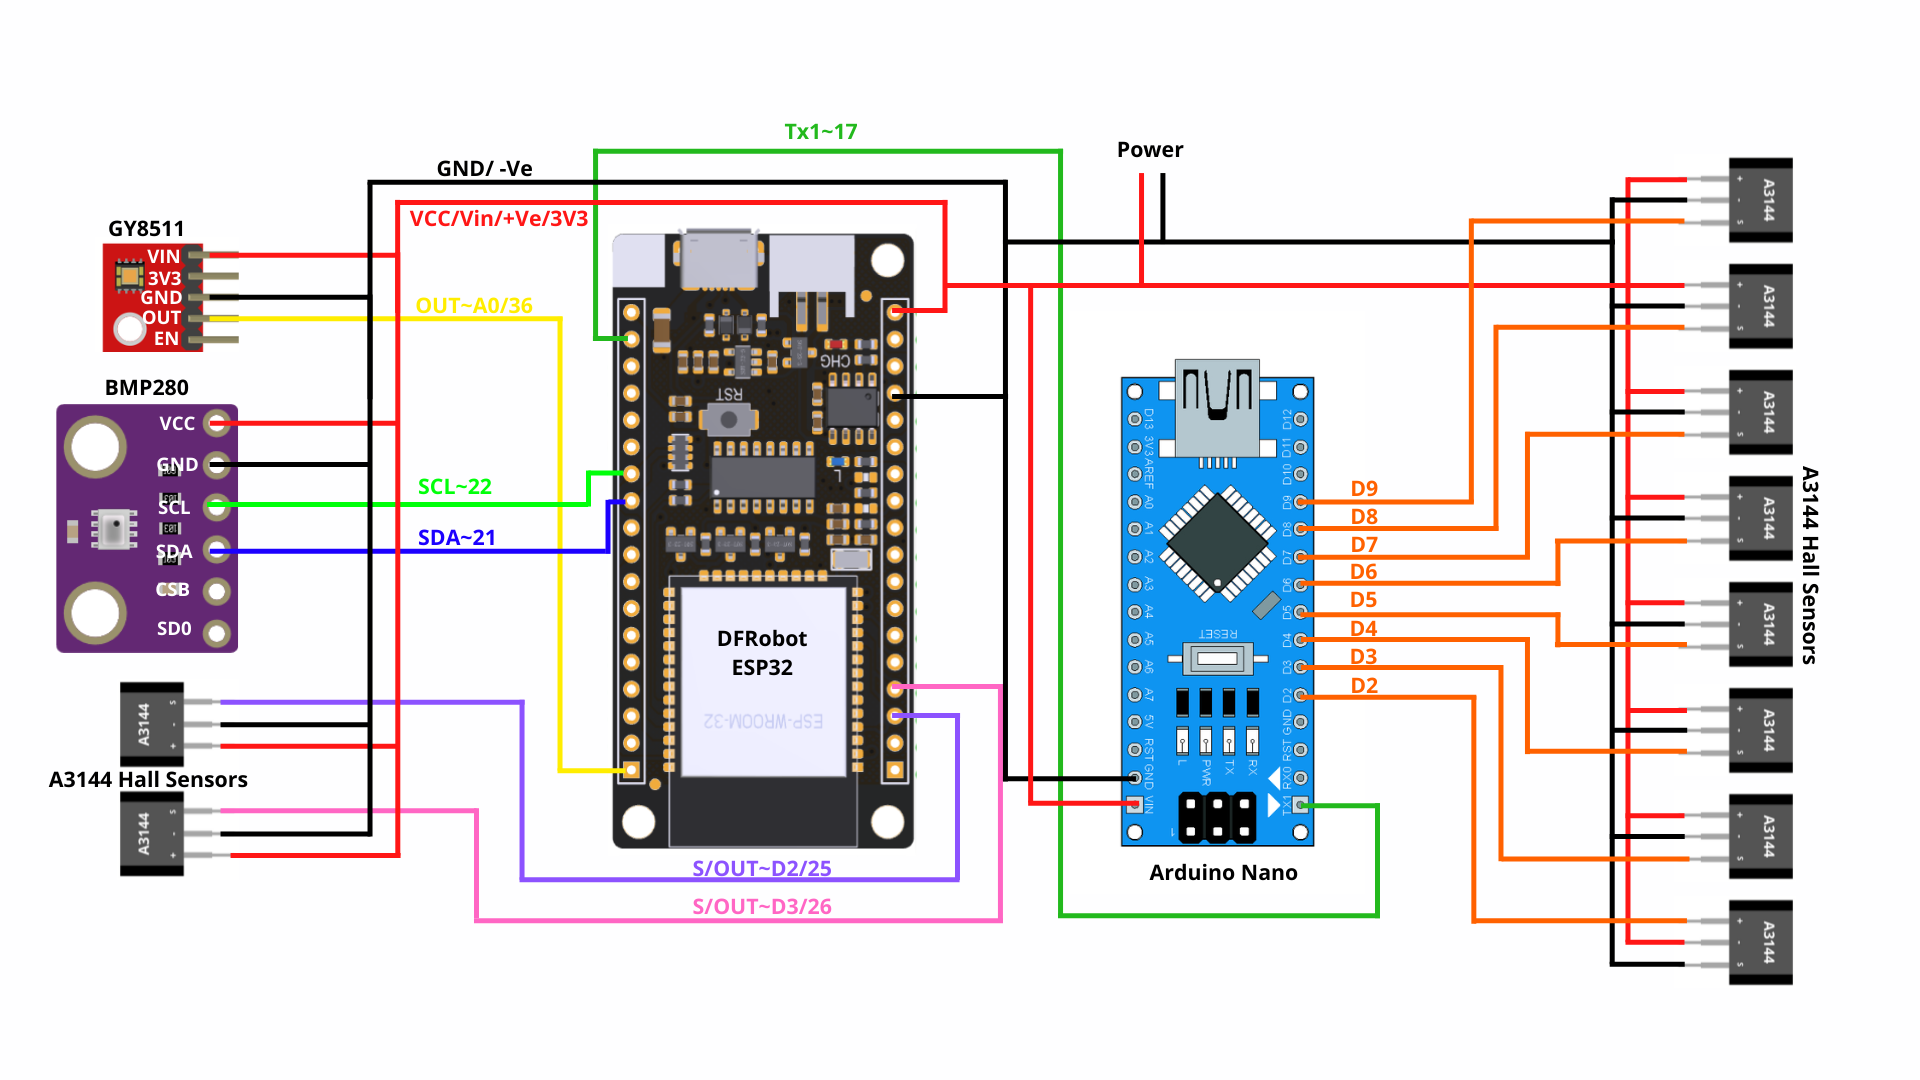
Circuit Connections:
.png)
- Make all the connections as shown in figure.
- We have used Arduino Nano to interface the 8 hall sensors for finding the wind direction and send it to ESP32 using UART serial.
- The other two Hall sensors are used for finding Wind speed(using RPM) and the Rain Fall(No.of times bucket tilted in minute).
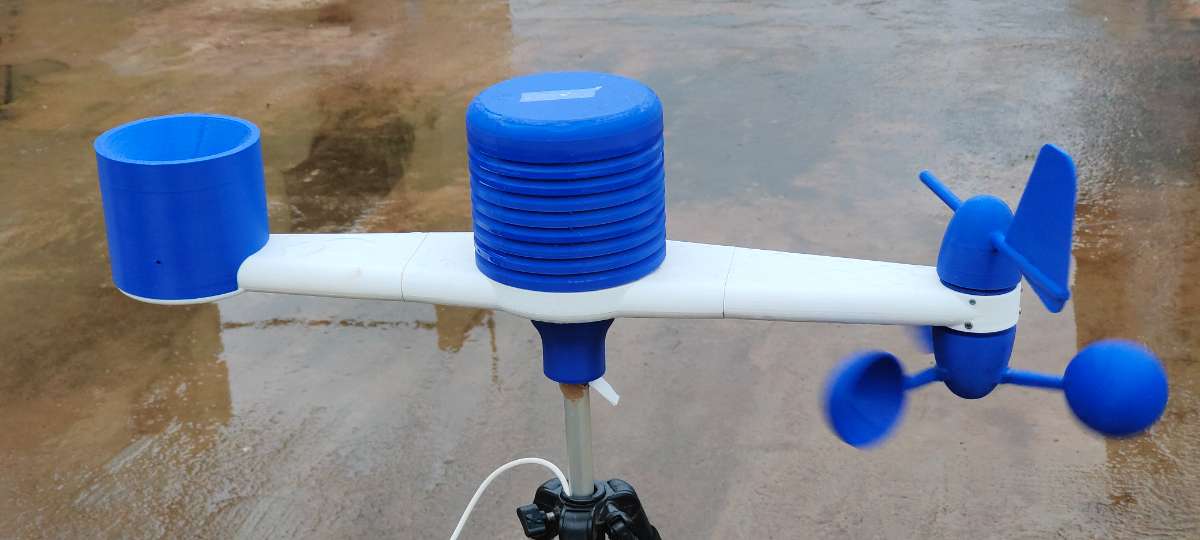
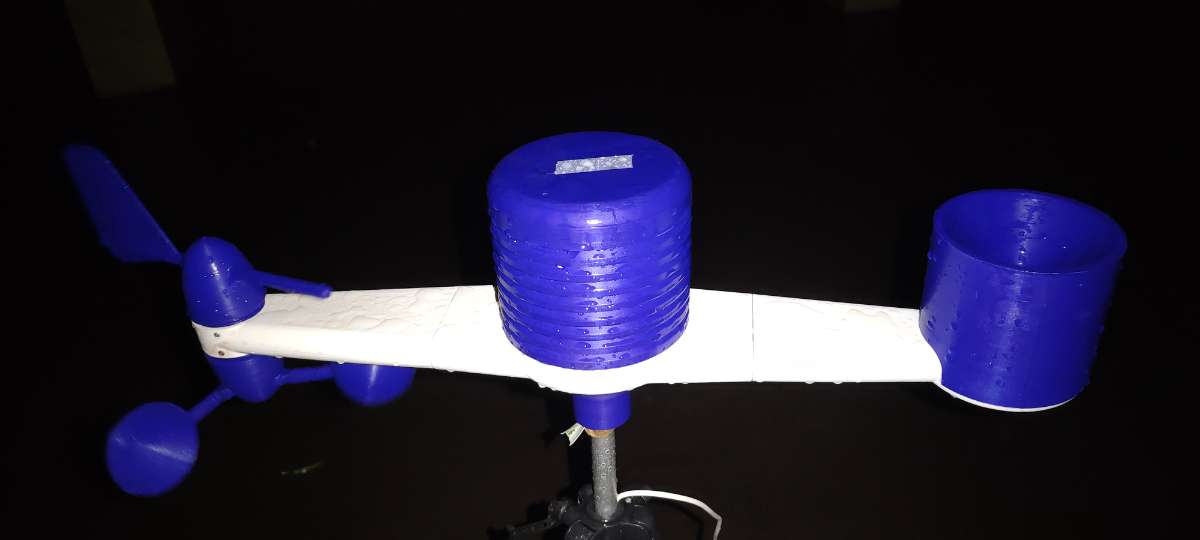
Final Product:
.png)
Credits
Built by 1 contributor
Comments8
Join the discussion — share a question or tip.
Hi, one question left, I can't really find the bearing you are using (link not complete). Before I change the design, would you be able to share the used bearings? And... did you press or glue these to hold the windspeed part?
Here is the link: https://amzn.in/d/4dHG7we I did press them.
Replying to @MukeshSankhla
Great, thanks! If I press the bearing into the hole of the base part, then the windspeed part will not eve touch the bearing? Or do you press the bearing over the 2mm rig on the windspeednpart, fix it with a screw thru the bearing middle and then press this into the base part till it jist not trouches eachother?
Sorry, I noticed the CAD files inthe link Fusion 360. Already started working on it. A small change in part1 so that no water comes into the windspeed part.
Hi, congrats, you made a great project here! I am looking to remake this a little to be able to accommodate a BME-680 sensor to be able to measure air quality. I also would like to use a GUVA-S12SD UV sensor. Besides that, I would like to add some 18650 batteries and a solar panel to make it work independly from a power supply. Therefore it would be great (and easy) if you are willing to share the Fusion 3D or STEP files so I can modify a bit, My sinsere thanks. Rinco van der Beek (email: rincovanderbeek@gmail.com)
nice project! keep it up...
Great Project . Good work.
Nice work!